For questions, remarks, or suggestions please contact mdoering@mpi-inf.mpg.de.
With the introduction of maraviroc to the American market in 2007, physicians had at their disposal a new member of the class of drugs preventing HIV cell entry through a novel mechanism.
maraviroc is an entry inhibitor acting as a CCR5 coreceptor antagonist that obstructs the CCR5-coreceptor, which is necessary for viral cell entry.
However, cell entry is not only determined by the CCR5-coreceptor, but also by the CXCR4 coreceptor. Whether the virus is able to use the CXCR4-coreceptor depends on the
structure of its surface protein, whose V3 loop is highly variable.
Therefore, some HIV particles can only use the CCR5-coreceptor (R5 virus), others can only use the CXCR4-coreceptor (X4 virus), and some can use both (dual-tropic virus).
Before prescribing coreceptor antagonists to a patient, it is important to determine viral coreceptor usage.
However, phenotypic idenfication of coreceptor usage is expensive and time-consuming.
For this reason, geno2pheno[coreceptor-hiv2]
was developed. It predicts HIV-2 coreceptor usage from the third variable loop (V3 region) of the gp105 envelope glycoprotein.
The tool is based on a support vector machine (SVM) that was trained on sequences of the V3 region annotated with phenotypically determined coreceptor usage.
The annotated phenotype is either R5, indicating that the virus can use only the CCR5 coreceptor, or X4-capable, denoting either an X4 virus, a dual-tropic virus, or a mixed infection (R5X4).
The SVM determines the hyperplane yielding a separation between observations from the two classes resulting in the largest margin.
From this hyperplane we receive for every position in the V3 loop a numeric value, also called weight,
indicating whether an amino acid at a certain position is indicative of an R5-or an X4-capable virus.
Upon entering a nucleotide or amino acid HIV-2 sequence containing the V3 loop, the sequence is automatically aligned to a V3 loop profile
reflecting the frequencies of individual amino acids. Using the learned weights from the model, a linear combination of weights is computed for the input sequence,
yielding the decision value. If the decision value is smaller than a cutoff value, the input sequence is classified as originating from an X4-capable variant or otherwise as R5.
The cutoff for the decision value depends on the cutoff for the false positive rate (FPR) that is set by the user. Here, the false positive rate reflects the probability of
incorrectly classifying a sequence as X4-capable, when the true phenotype is R5.
Low FPRs therefore indicate high-confidence predictions for X4-capable viruses, while higher FPRs point towards R5-tropic viruses.
Sequences with an FPR below the FPR cutoff are predicted as X4-capable, while sequences aboe the cutoff are predicted as R5.
The tool consists of two screens: when visiting the
geno2pheno[coreceptor-hiv2]
web site, the input page is shown. Here, you can select an FPR cutoff and
enter or upload your sequence. On clicking the "Align and
Predict" button, the output page is displayed.
This may take some seconds due to the computations that have to be performed.
The input page consists of five parts:
The "identifier" field. The identifier field can be used to enter supplementary information that can be used to identify the input sequences. The output results contain the identifier along with other information, such as the FASTA header of the input sequence (if available) and the date of the prediction.
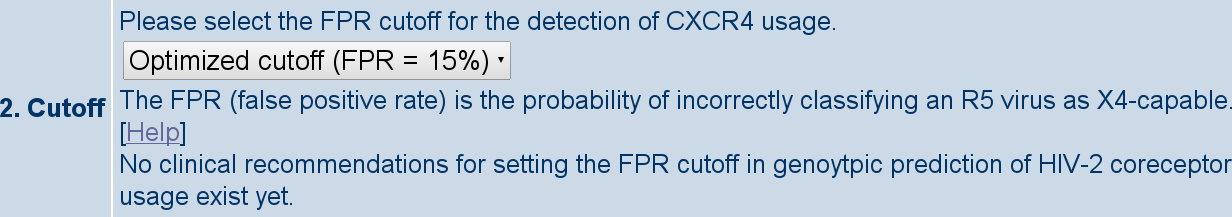
Selection of the FPR cutoff. The FPR cutoff determines how conservative the prediction of X4-capability will be. By setting a low FPR cutoff, only few sequences will be predicted to originate from X4-capable viruses. The drawback of a conservative classifier is that some sequences from X4-capable variants will remain undetected. This is the fundamental trade-off in classification. If the FPR cutoff is increased, the tool will be more sensitive towards X4-capability. In this case, the tool will identify a greater number of true X4-capable variants at the cost of a larger number of "false positives (i.e. sequences for which usage of the CXCR4 coreceptor is erroneously predicted). More technical details on FPR cutoffs are explained further down.
Input of the sequence data. The V3 loop sequences can be inputted in two ways. The first way is to specify a file to be uploaded. The second way is pasting sequences (plain or FASTA format) into the text field. two fields. Whichever of the two ways you choose, the sequences may either be in plain text or in FASTA-format.
The action box. Using the dropdown menu, you can select the action you would like to perform next. The most important option is labelled as "Align and Predict". Upon selecting this option, the V3 region will be extracted from your sequence, an alignment will be computed, and a prediction will be made. The results will be shown on the output page, which is displayed when the computations are done. The "Reset form" option can be used to clear the form and to set the significance levels back to the default values. "Load a sample sequence" can be used to get to know the program without the need to supply a sequence. Finally, the "Switch to vertical layout" selection allows users with small displays to see the page properly.
The FPR cutoff determines how conservative the tool is with regards to predicting X4-capability. In the following section, the FPR cutoff is explained in terms of the distribution of the SVM decision values.
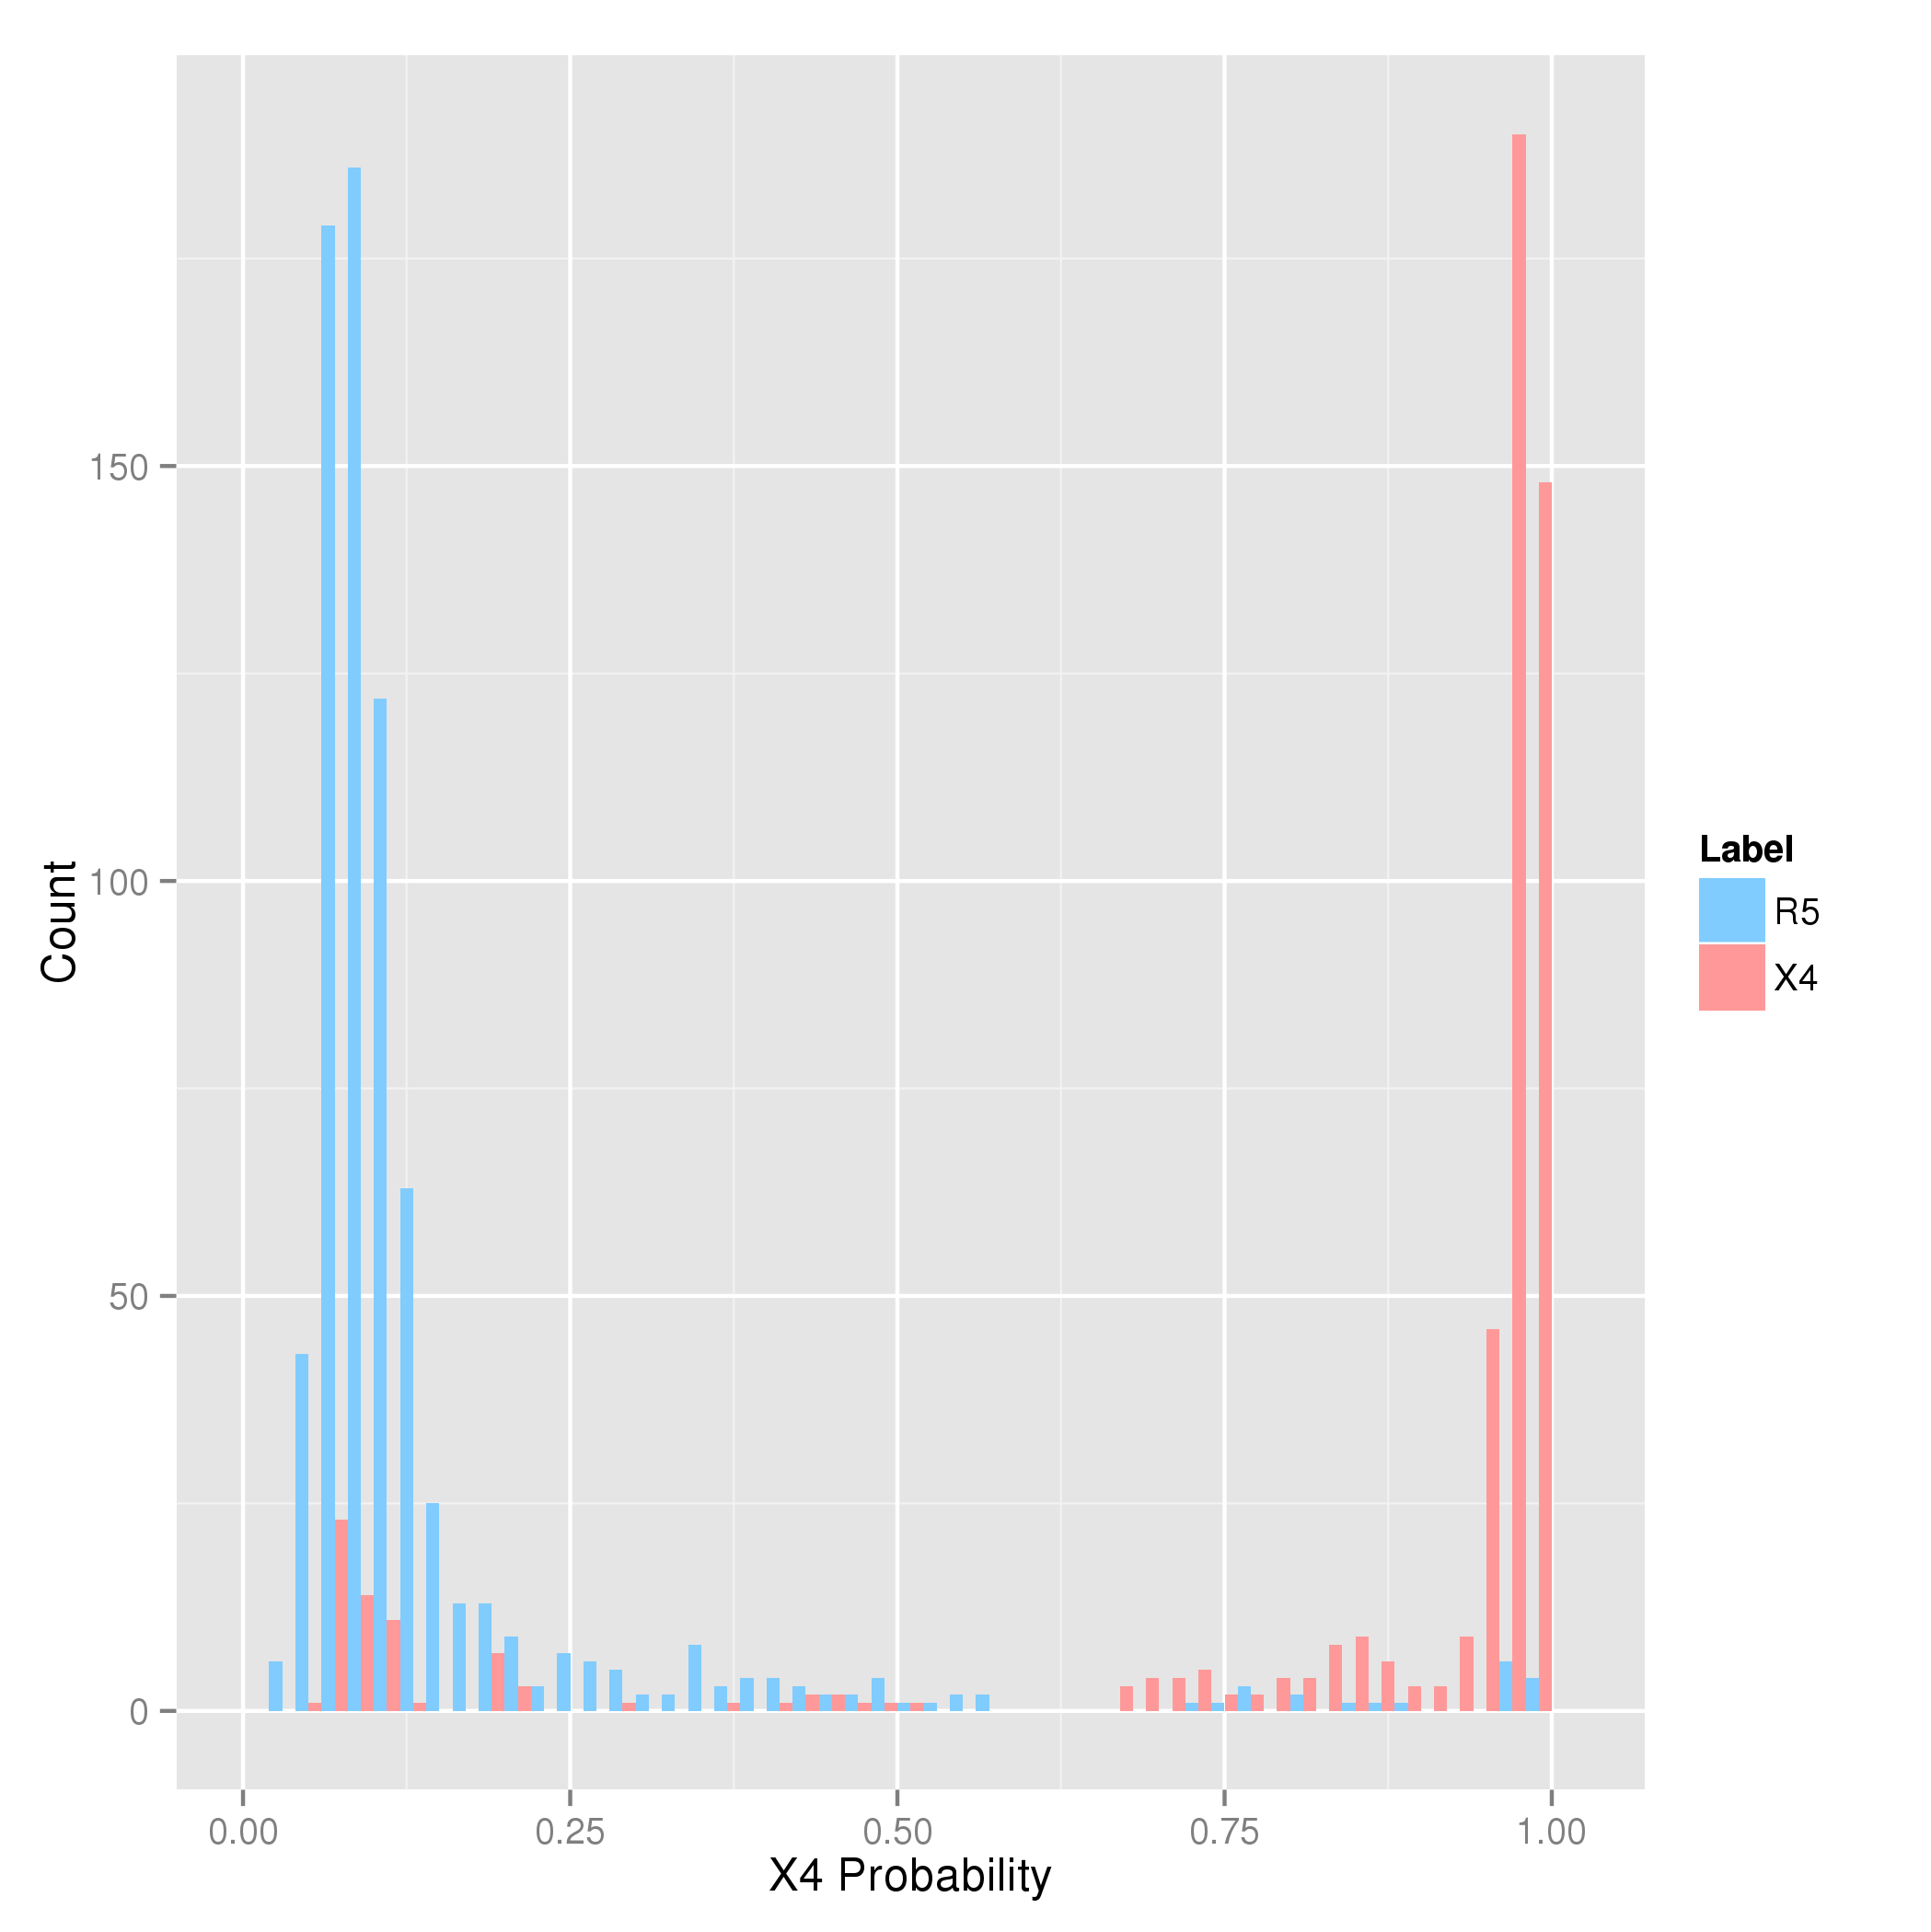
The histogram above indicates the frequency with which the SVM predicts a certain probability for X4-capability on sequences with known coreceptor usage. In the plot, the x-axis represents
the predicted probability of using the CXCR4 coreceptor, and the y-axis shows the number of samples which were assigned a particular probability by the method.
The phenotypically determined coreceptor usage is color-coded: frequencies for R5-viruses are shown in blue, while frequencies for X4-variants are shown in red.
Because we are interested in detecting X4-capability, sequences that are labeled as X4-capable (in red) are called "positive" samples, while the others are called "negative" samples.
When the SVM predicts a large probability for X4-capability, this indicates that the input sequence is highly similar to other X4-sequences from the training stage of the model, and, therefore,
the input sequence is also probably capable of using the CXCR4 coreceptor.
From the plot one can see that there is a tendency for positive samples to attain a higher probability than the negative samples.
However, since no model is without fault, there is no perfect separation between the distributions of positive and negative samples. Looking precisely at the plot, one can see
that the overlap between the distributions is imbalanced. There are more sequences from X4-capable variants with a low probability than there are sequences from R5-viruses with a high probability.
This means that the method is more specific in identifying R5-viruses than it is sensitive in identifying X4-variants.
Because it is not possible to differentiate perfectly between R5 and X4-capable variants, setting different cutoffs on the probability to separate the two classes will yield different results
in terms of sensitivity and specifity. If a certain cutoff is set, all samples with a probability greater than the cutoff are predicted as X4-capable and all others as R5.
To understand the trade-off between limiting false positive results and a high sensitivity, have a look at the
following plot, where three possible cutoffs are indicated.
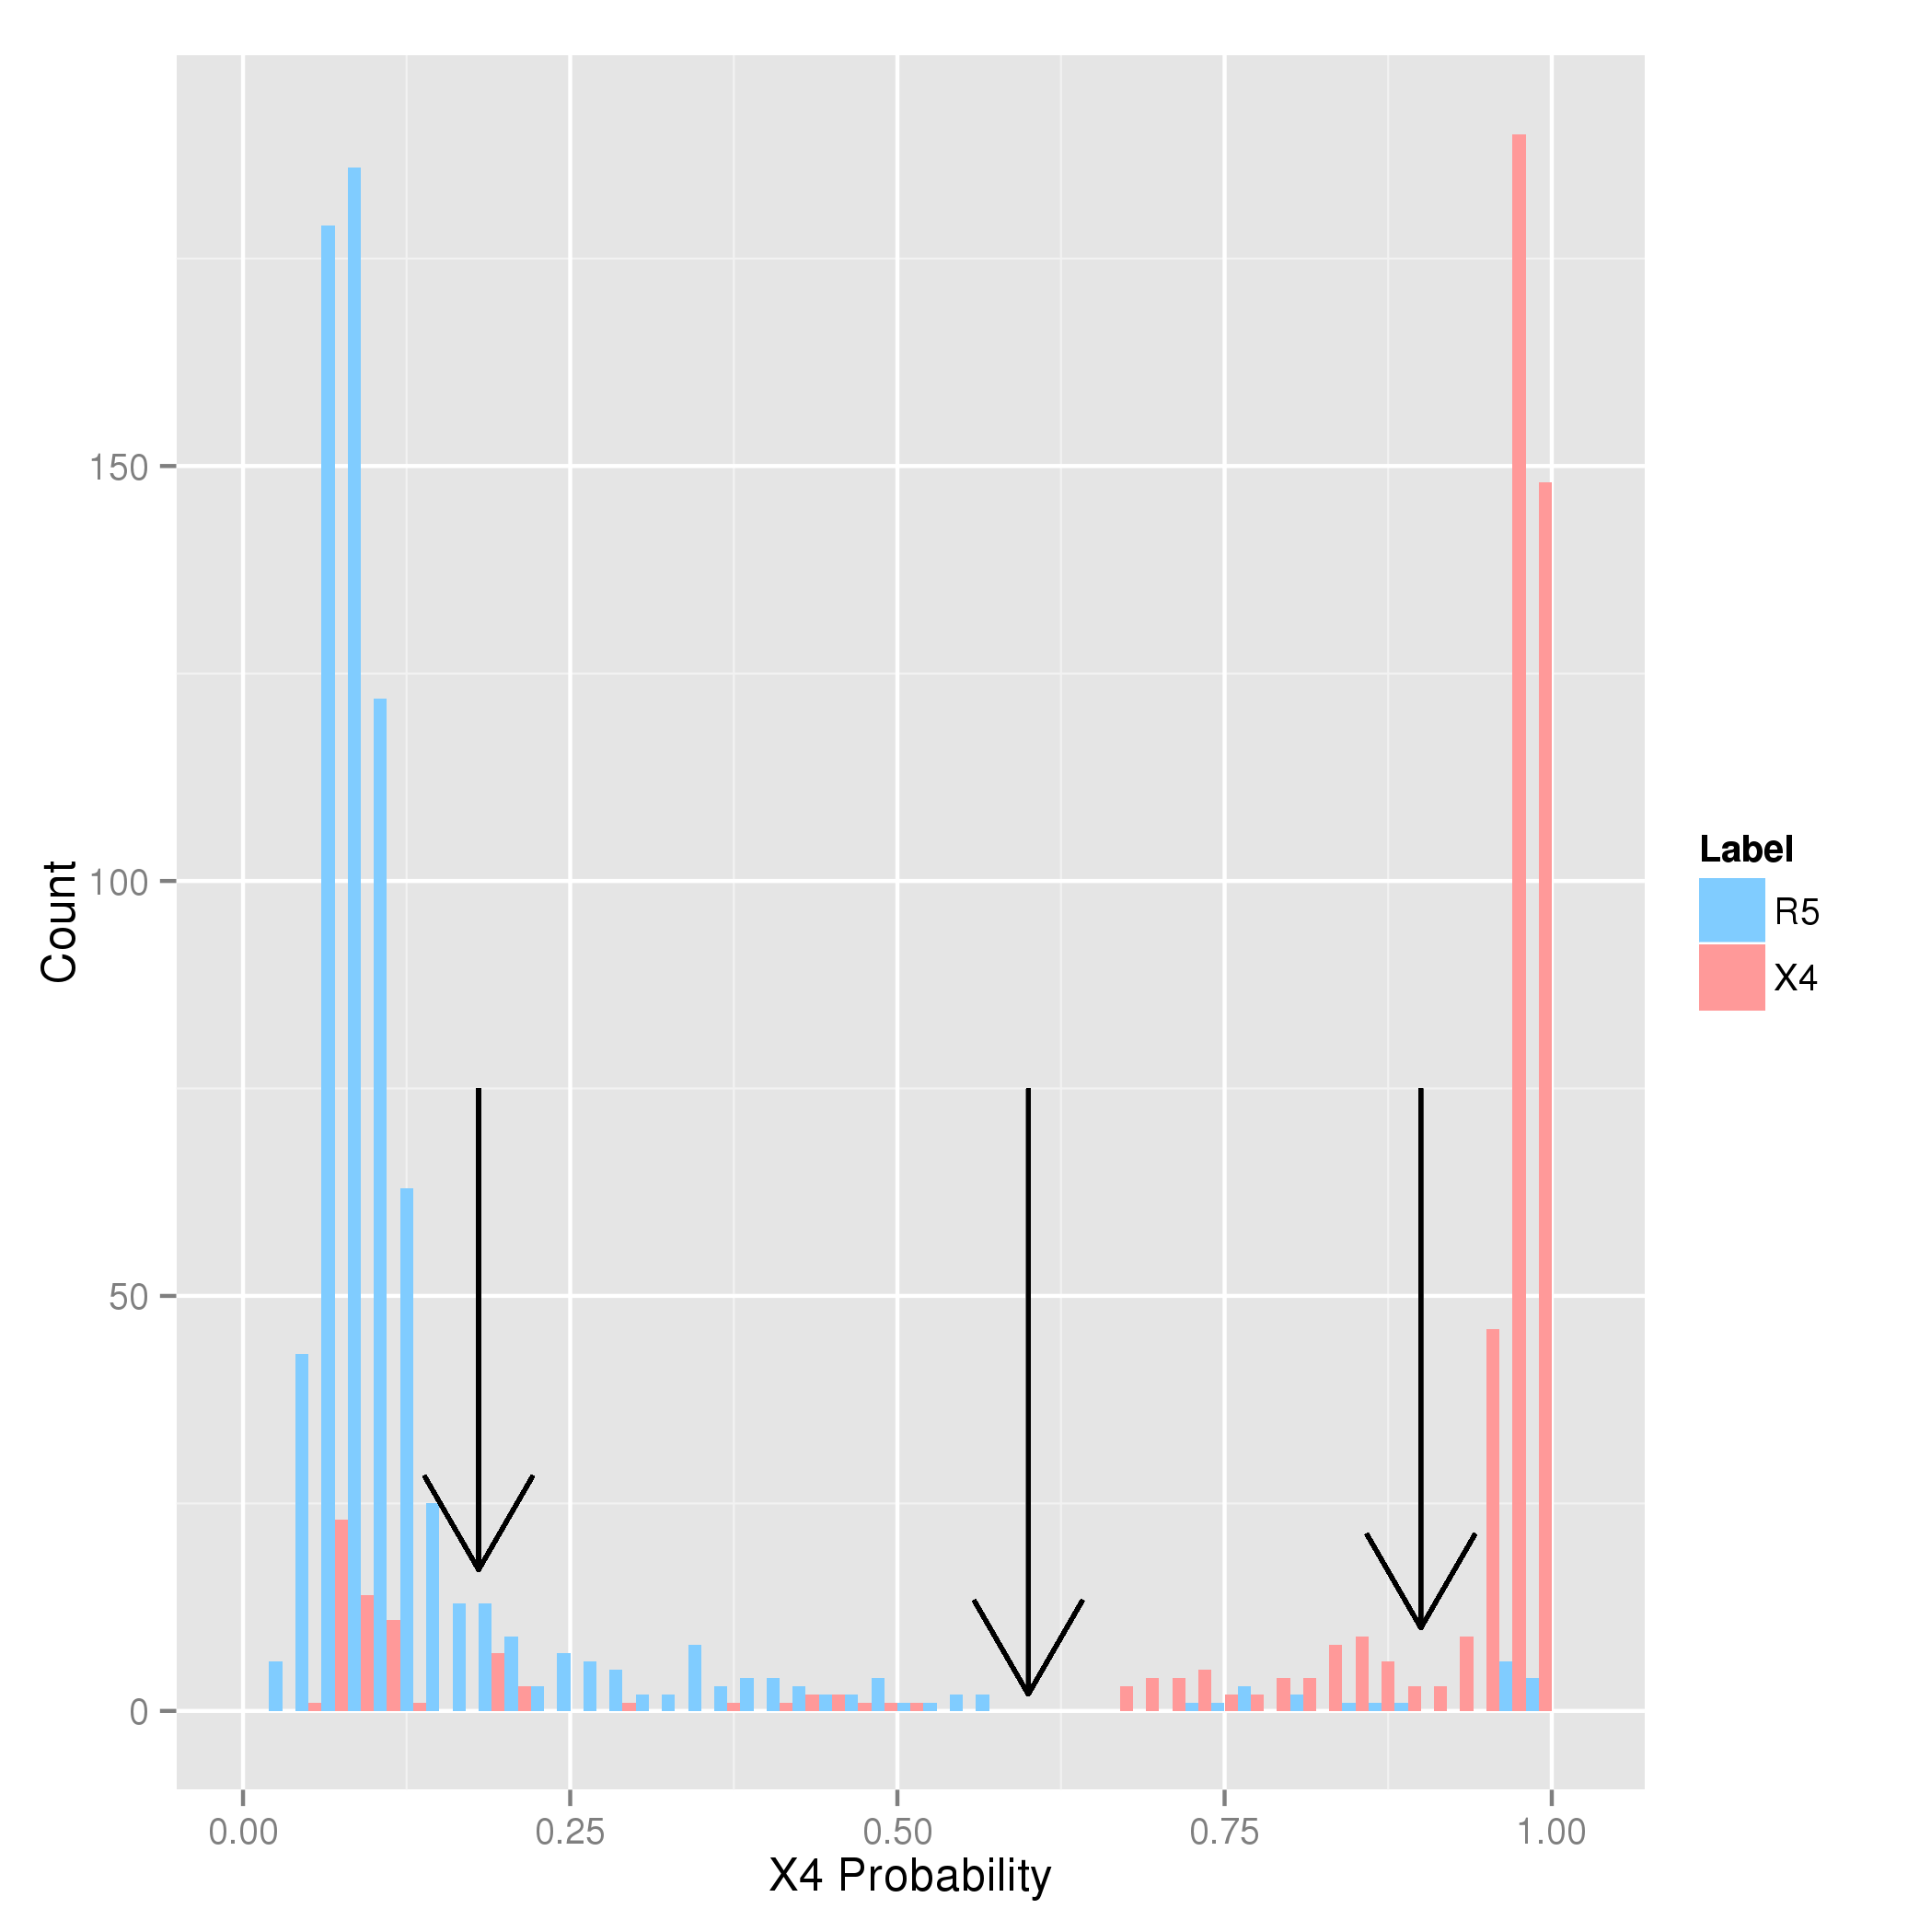
First, imagine that you select the leftmost cutoff at a probability of 18%.
Using this cutoff, all samples with predicted X4 probabilities below 18% will be predicted as
R5, and, otherwise, as X4-capable. Looking at the plot one can see that with this choice of cutoff, most of the X4-capable samples (in red) will be detected,
but there will also some "false alarms", since some X4-incapable samples score above this cutoff as well.
Assume now that you have chosen the rightmost cutoff at at probability of 90%. With this cutoff, there will be fewer false alarms, but also a reduced sensitivity because
all samples with a probability below 90% that are actually X4-capable will be predicted as R5.
A suitable choice of cutoff will likely be somewhere in between these two extremes. With the cutoff indicated in the middle (at 60%), you will
almost never predict X4-capability by mistake because many X4-incapable samples have probabilities greater than 60%, yielding both a high sensitivity and specificity.
Still, it is important to realize that there is no "best" cutoff, but that the choice of cutoff rather depends on the interests of the user.
If one wants to have few false alarms and missing some X4-capable sequences is acceptable,
one might want to choose a higher probability for X4-capability as a cutoff (i.e. a lower FPR cutoff). However, if one is interested
in finding as many X4-capable sequences as possible, a lower cutoff (i.e. a higher FPR cutoff) would be a good choice.
geno2pheno[coreceptor-hiv2] provides you with a quantitative basis for choosing a cutoff for the FPR, as shown in the picture below:
The problem with which we are dealing here is called binary pattern classification (binary, because there are just two different labels. In binary classification, a prediction can have four different outcomes, which depend on the true and predicted class of a sample. These outcomes are summarized in the table below:
| true class | |||
| 1 | -1 | ||
| predicted class | 1 | true positive | false positive |
| -1 | false negative | true negative | |
The numbers which are shown in the select box, indicate, how often these different events happen:
We now also see why the false positive rate equals 1 - specificity, since P( YP = 1 | Y = -1 ) = 1 - P( YP = -1 | Y = -1 ).
The trade-off between detecting many positive samples and predicting few
negative samples as positive is reflected by the FPR cutoff.
For example, an FPR cutoff of 10%
means that 10% of X4-incapable samples will be incorrectly predicted as
X4-capable by our classifier. If you want to be more confident that a virus is really
X4-capable, you should choose a smaller cutoff (e.g. at 5%).
Hoowever, this comes with the drawback that some X4-capable viruses will be missed and falsely predicted as R5, thereby decreasing the rate of true positives.
When you have selected the "Align and Predict" option and the prediction has ben computed , the output screen will appear. The output page has four parts:
General information. Three kinds of information are shown here: the sequence identifier, the FASTA header of the sequence, and the date of the prediction.
Aligned V3 region. This section shows alignment of your input sequence in comparison to the HIV-2 reference strain Mac239. The numbers reflect the position in the V3 region of HIV-2, counting the residues of Mac239 starting with 1. The alignment is based on an alignment against a profile of HIV-2 sequences to account for variability in the V3 loop.
Predicted phenotype. The predicted phenotype is either R5 (CCR5 use only) or X4-capable CXCR4 can be used). A sample is predicted as X4-capable if its FPR is below the FPR cutoff and as R5 otherwise. If the virus was predicted to be X4-capable, a red background is shown warning that CCR5-anatagonists should not be prescribed. Otherwise, a green background is displayed notifying that CCR5 antagonists should be effective.
![geno2pheno[coreceptor-hiv2] prediction result](imgs/predictionResult.png)
The plot indicates the outputs of the prediction model for an input sequence.
The x-axis indicates the positions and amino acids occurring in the V3 reference sequence extracted from the HIV-2 reference sequence Mac239.
Insertions in the query sequence are indicated by a postfixed i (e.g. 22i).
The y-axis gives the coefficients of the model for the input sequence.
Negative values indicate amino acids associated with X4-capable variants (red), while positive values indicate amino acids associated with R5 viruses (blue).
The opacities of the red and blue areas are scaled in correspondence with the predicted values for the FPR and TPR, respectively.
For example, a low FPR indicating a confident prediction of X4-capability results in a darker red, but a lighter blue color.
On the left side of the plot, there are labels for R5 and X4-capable.
The label of the predicted coreceptor is colored in black; the other one is in grey.
The legend on the right shows the plot colors for all amino acids including the gap symbol (-).
In the bottom right corner, the FPR of the input sequence are indicated.
Consider the following visualization as an example:
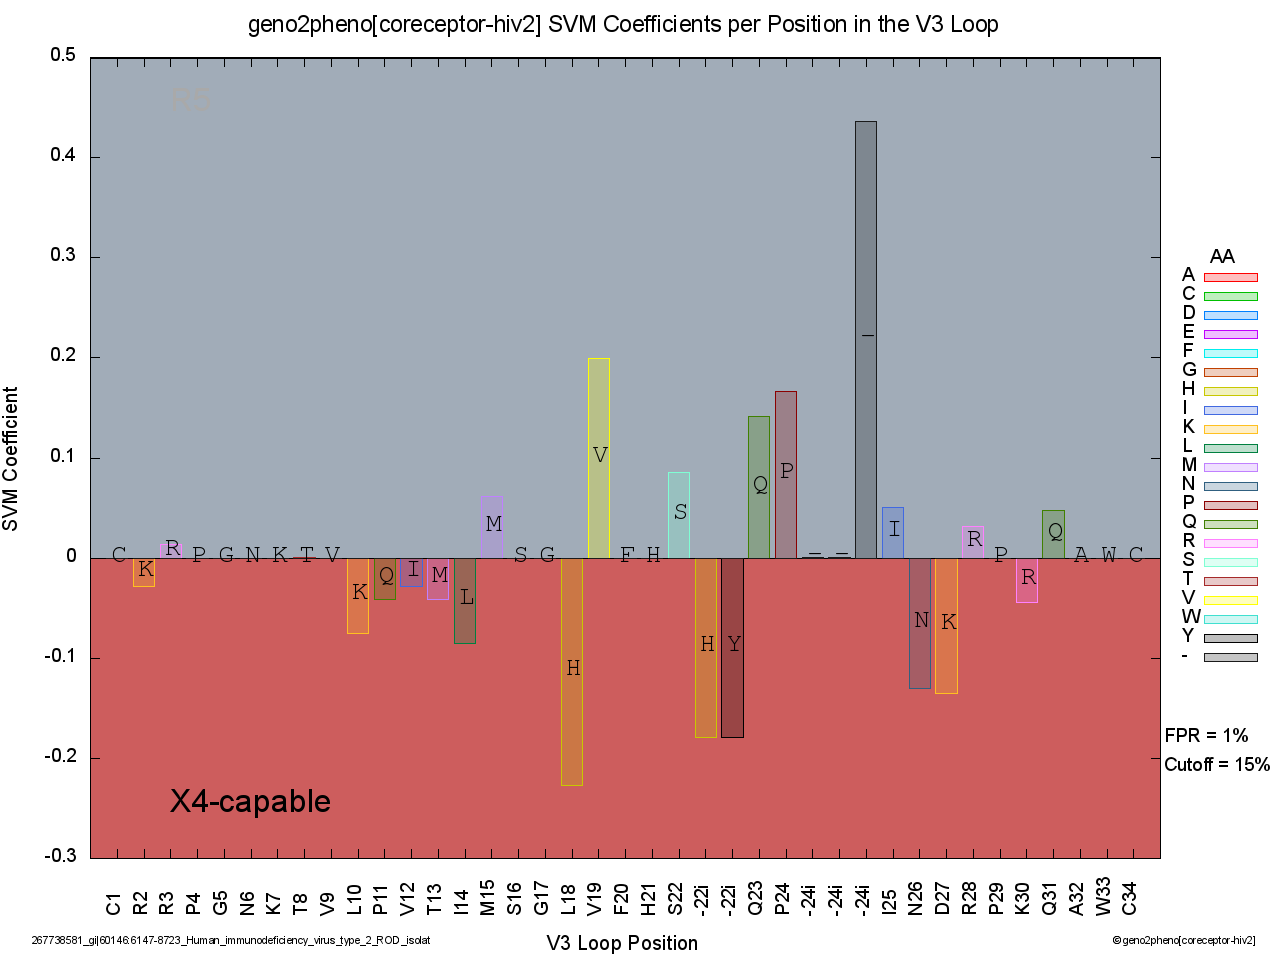
With just a single look at the black X4-capable label, we see that the virus was classified as an X4-capable variant. Moreover, the dark red hue of the background indicates a high-confidence prediction, which is confirmed by looking at the low FPR value on the right of the plotting area. To understand why an X4-capable variant was predicted, we look at the negative coefficients from the SVM, of which four stand out the most: 1. the L18H mutation, 2. the insertion of histidine (H) after position 22, 3. the insertion of tyrosine (Y) after position 22, and 4. the D27K mutation at position 27. It is important to note that a small number of mutations or insertions is already predictive of X4-capability. In this example, the plotting area relating to positive coefficients (R5) is larger than the one for negative coefficients (X4-capable), yet the virus is still confidently classified (FPR = 1%) as being an X4-capable variant.
geno2pheno[coreceptor-hiv2] is based on a statistical learning method called support vector machine (SVM). We used the libsvm implementation of SVMs.
The coreceptor problem has three classes (R5,X4,R5X4), but the differentiation between viruses using the CCR5 coreceptor
and those capable of using the CXCR4 coreceptor is clinically most relevant. Furtheremore,
too few data are available for a statistically robust prediction of R5X4 variants, which might also indicate populations of mixed variants.
This is also the reason why other chemokine coreceptors cannot be predicted as of now. Therefore, we have trained models for the detection of X4-capability only.
The current model (2015-09-03) was trained on 140 amino acid sequences of which 91 (65%) were labeled as R5 and 49 (35%) as X4-capable.
The data were gathered from the
Los Alamos National Laboratory HIV databases and our collaboration partners.
More information can be found in the "References" tab.